Projects

Title:
The Current State of COVID-19 From 3 Different Perspectives | Data Visualization
Project Status: Currently Not Maintained
Description:
The purpose of this project is to have a look at the current state of COVID-19 using visualizations from different geographical perspectives. The plots have been created by using data visualization tools such as Plotly and Folium. The project is broken down into three parts.
- Global COVID-19 Situation: We will display a folium map that shows the total cases, total deaths, total cases per 100,000, and total deaths per 100,000. In addition to that, we will display various time series plots to understand better how the disease spreads over time across the globe.
- COVID-19 Situation by World Health Organization Region (WHO): In the following section, we look at the disease from the World Health Organization's regional perspective. We will compare the different regions based on their total cases, total deaths, total cases per 100 million and total deaths per 100 million deaths.
- COVID-19 Situation in the United States: Last but not least, we pay our attention to the United States and explore the current situation in the US based on the cases, deaths (with and without per capita), vaccine status, and the status of the different variants spreading across the states.
Technologies:
Streamlit, Python, Pandas, NumPy, GeoPandas,Folium, Plotly, Branca, Jinja2, Date

Title:
California Data Science Job Market Analysis | Exploratory Data Analysis (EDA) Problem
Project Status: Completed
Description:
The purpose of this project is to examine the current data science job market in California. Which city has the most job posts in California and offers more opportunities? As a current Data Science Master's student, I wanted to find out which jobs a master's degree holder would be eligible to apply for and what skills are most in-demand.
Technologies:
Python, BeautifulSoup, Selenium, ChromeDriverManager, NumPy, Time, Random, Pandas, Uszipcode, Seaborn, Folium, Nominatim, Matplotlib, Template, MacroElement, Copy, PrettyTable.

Title:
An Examination of Fatal Force by Police in the US | Classification & Multi Classification Problem
Project Status: Completed
Description:
In this project, we examine the factors that play into the horrible event of a fatal shooting by the police in the United States of America. Which ones carry more weight that lead to fatal shootings and are perhaps predictive in nature? Are they race? State location? Mental Illness? Based on our findings from the dataset of the available variables, we looked to predict the deceased’s race or mental illness status.
Technologies:
Python, Pandas, NumPy, Re, Seaborn, Matplotlib, Copy, Geopandas, Folium, Nominatim, Template, MacroElement, Sklearn, RandomizedSearchCV, PrettyTable.
Title:
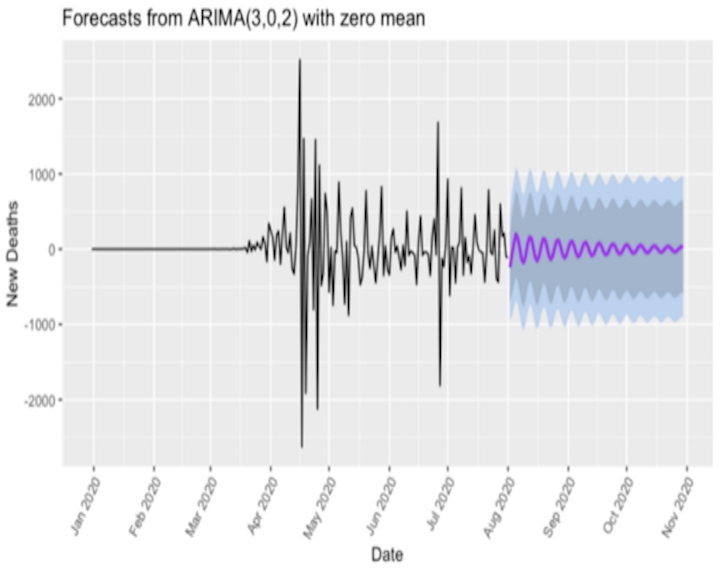
Predicting number of Covid19 deaths using Time Series Analysis (ARIMA MODEL) | Time Series Forecasting Problem
Project Status: Completed
Description:
In this project, a Time Series Analysis (ARIMA Model) predicts the number of deaths in the United States starting from August 1st – August 21st and August 1st – November 1st. The goal of this project was to compare our results with the projections that have been made by CNN. In addition to the comparison to CNN the aim was to get a deeper understanding of Time Series Analysis and the ARIMA model as well.
Technologies:
R, Ggplot2, Tidyverse, Zoo, aTSA, Ggplot2tseries, Forecast, Lubridate.